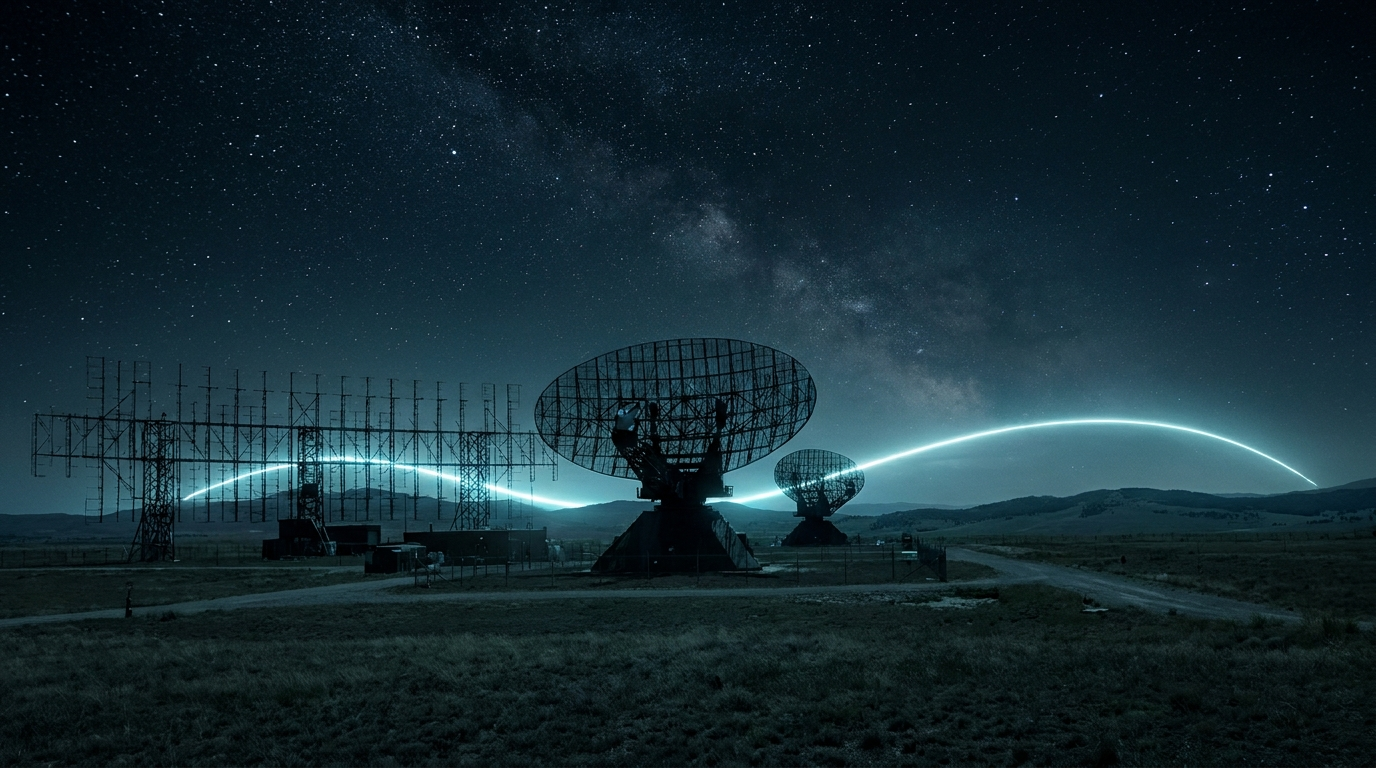
1The contested electromagnetic spectrum
Electronic warfare is a fight over information, and that fight happens in the radio spectrum. Whoever sees the spectrum first, and sees it most completely, holds the advantage. The problem is that the modern spectrum is crowded, fast, and adversarial. A single band can hold commercial communications, friendly waveforms, civilian radars, and the hostile emitters an operator actually needs to find. The threats that matter least are usually the easiest to see. The threats that matter most are usually designed to be hard to see.
Adversaries know that a strong, steady carrier is an invitation. So they make their emissions brief, faint, and unpredictable. A search radar might dwell on a sector for only a few microseconds before stepping elsewhere. A frequency-agile data link might hop hundreds of times a second across a wide band. A pop-up threat might key up for a fraction of a second, do its work, and go quiet before a slow instrument finishes looking somewhere else. These are low-probability-of-intercept emissions, and they are engineered specifically to defeat the way most analyzers look at the world.
Electronic support, electronic attack, and signals intelligence all depend on one prior capability: detecting the emission in the first place. An emitter that is never seen cannot be classified, geolocated, jammed, or added to a threat library. For the EW operator, the question is not only what the spectrum contains. It is whether the instrument can guarantee that a fleeting signal will not slip through unobserved.
2Why swept analyzers miss threats
A traditional swept-tuned spectrum analyzer builds its display by tuning a narrow filter across the band one frequency segment at a time. It looks at a slice, measures the power, steps to the next slice, and repeats. To cover a wide span the instrument has to make many of these steps, and each step takes time. While the analyzer is measuring one part of the band, every other part of the band is unobserved. That unobserved interval is sweep blind time, and it is the structural weakness an adversary exploits.
Consider the arithmetic. If an instrument needs tens of milliseconds to sweep a wide span, a pulse that lasts a few microseconds will, with overwhelming probability, occur while the sweep is looking somewhere else. The energy was present in the air. The analyzer simply was not pointed at that frequency at that instant. The signal was not faint or hidden. It was missed because of when the measurement happened, not because of how strong it was.
Frequency-agile emitters compound the problem. A hopping transmitter that changes frequency faster than the analyzer completes a sweep will paint the display with disconnected fragments, or with nothing at all. The operator sees an occasional speckle and cannot tell whether it is a real emitter, a glitch, or noise. The threat hides not by being quiet, but by never being in the same place twice when the instrument happens to look.
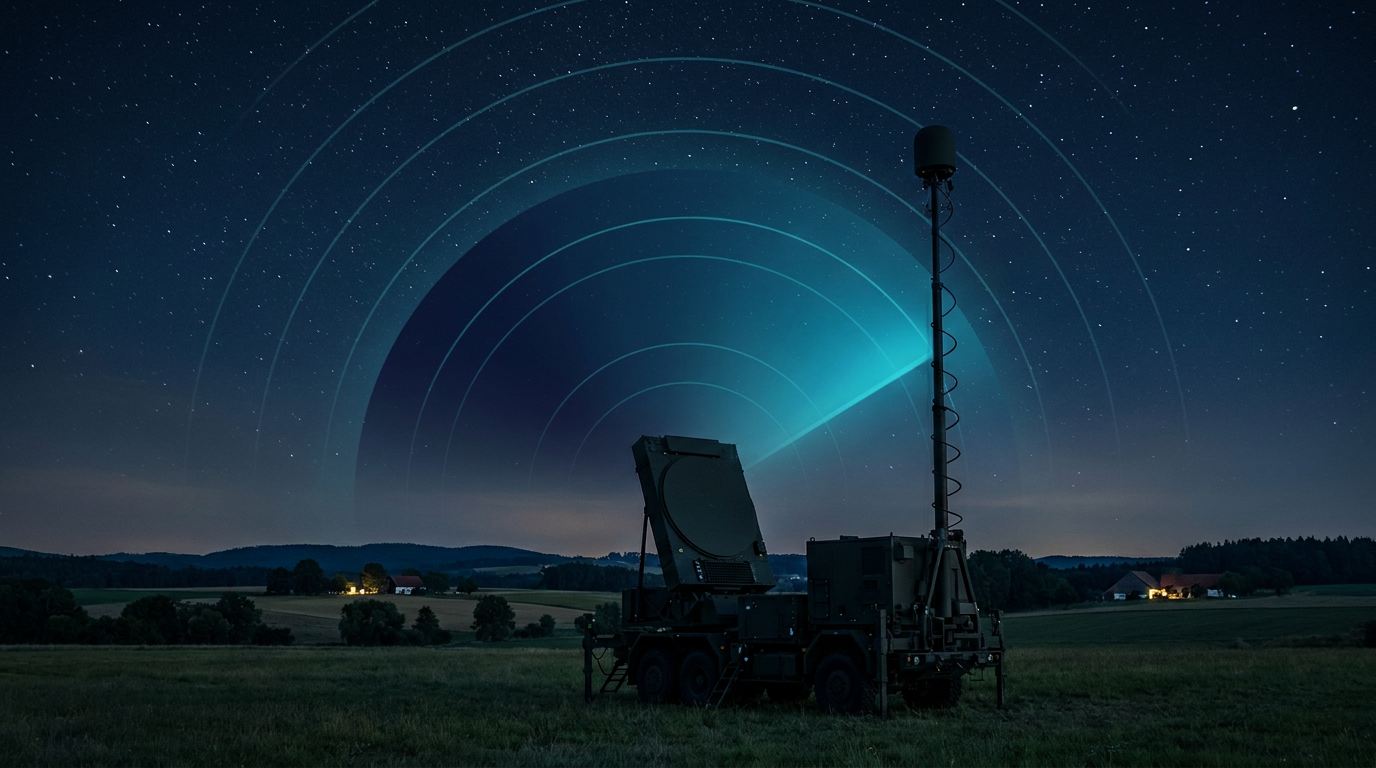
3Real-time capture and 100% probability of intercept
A real-time spectrum analyzer removes the blind time. Instead of tuning a filter across the band, it digitizes the entire instantaneous bandwidth at once and runs a continuous stream of fast Fourier transforms on the incoming samples. The transforms are computed back to back, with no dead interval between them, so every fraction of energy that enters the front end is converted into a spectrum. There is no moment when part of the band is unobserved. The band is always being processed.
This is what makes a real-time analyzer suitable for electronic warfare. With contiguous FFT processing and a small overlap between successive transforms, the instrument can guarantee that any signal lasting longer than a defined minimum will be detected at full amplitude. That minimum is the probability-of-intercept duration, usually written as POI. POI is the shortest signal an analyzer is guaranteed to capture with full accuracy, and on a capable real-time platform it falls into the microsecond and even nanosecond range.
POI is the figure that matters for pop-up threats. A pop-up emitter that keys for a few microseconds is invisible to an instrument whose POI is measured in milliseconds, and it is fully captured by an instrument whose POI is shorter than the emission. The shorter the guaranteed POI, the briefer the threat the operator can still see, classify, and act on. In EW the difference between a guaranteed microsecond POI and a best-effort sweep is the difference between a complete order of battle and a dangerous blind spot.
4Density and persistence displays
Capturing every spectrum is necessary but not sufficient. A real-time analyzer produces far more spectra per second than an operator could ever read one at a time. The instrument generates thousands of transforms per second, and a faint, intermittent emitter would be lost in the blur of a conventional trace. Density and persistence displays solve this by accumulating many transforms into a single picture and coloring each point by how often signal energy appears there.
The effect is that frequency of occurrence becomes visible. A strong continuous carrier and a rare, weak burst both leave marks, but the display distinguishes them by persistence. A signal that hides underneath a stronger one, at the same frequency but present only briefly, separates out as a distinct trace because its rate of occurrence differs. This is how an operator pulls a low-level threat out from under a dominant commercial signal that would otherwise mask it entirely.
For electronic warfare this is the needle-in-the-haystack tool. The haystack is the dense, busy spectrum full of friendly and benign emissions. The needle is the rare, low-power, intermittent emitter that an adversary hoped would blend in. A persistence display brings that needle forward visually, so the operator can recognize a pattern that a single snapshot would never reveal.
5Frequency-mask triggering
Once an operator knows what normal looks like, the next problem is automation. No one can watch a display for hours waiting for a signal that may appear for a millisecond at an unknown time. Frequency-mask triggering turns that vigil over to the instrument. The operator defines a spectral mask, an outline drawn around the expected, allowed spectrum, and arms the analyzer to trigger whenever incoming energy breaks through the mask.
Because the analyzer processes the band gap-free, it can compare every single transform against the mask in real time. The instant a signal rises above the mask at any frequency, the trigger fires and the instrument captures the underlying IQ data around the event. Nothing has to be sweeping past the right frequency at the right time. The mask is watching the whole span continuously.
This is the natural way to catch intermittent and hopping emitters. An emitter that appears only occasionally will eventually break the mask, and when it does the trigger-to-IQ capture records the raw samples for analysis. The operator returns to a stored capture of the exact event rather than a memory of a flicker. Trigger conditions can be tuned so that benign signals inside the mask are ignored and only the anomalies that matter are recorded.
6Pulse and PDW analysis
Detection answers whether an emitter is present. Characterization answers what it is. Radar and many threat emitters are pulsed, and their signatures live in the timing and shape of those pulses. Pulse analysis measures the parameters that distinguish one emitter from another and reduces a complex capture to a stream of pulse descriptor words, or PDWs, that summarize each pulse compactly.
The core parameters are straightforward to state and rich in meaning. Pulse width is how long each pulse lasts. Pulse repetition interval, or PRI, is the time between successive pulses, and its inverse is the pulse repetition frequency. Duty cycle is the fraction of time the emitter is actually transmitting, the ratio of pulse width to PRI. Intra-pulse modulation describes how the signal changes within a single pulse, for example a linear frequency chirp or a phase code, which is often the most telling fingerprint of a specific radar.
Taken together these measurements let an operator separate a navigation radar from a tracking radar, recognize a known threat from its modulation, and detect changes in an emitter's behavior that signal a change in its mode or intent. A real-time analyzer that can record IQ and generate PDWs gives the analyst both the raw evidence and the compact summary needed to classify and track an emitter over time.
7Frequency-hopping and agile signals
Some of the most demanding EW targets do not sit still in frequency. Frequency-hopping data links and agile radars change their carrier on a fast schedule, deliberately, to resist detection and jamming. A single spectrum snapshot cannot describe such an emitter, because by the time the snapshot is read the signal has already moved.
The spectrogram, also called a waterfall, is the right view for these signals. It stacks successive real-time spectra over time, with frequency on one axis, time on another, and amplitude shown as color. A hopping emitter that looks like random speckle on a single trace resolves into a clear pattern on the waterfall, a sequence of dwells stepping across the band. The operator can read the hop set, the order and timing of the frequencies the emitter visits, directly from the picture.
Because the underlying capture is gap-free, the waterfall does not lose hops between frames. Every dwell that lasts longer than the POI is recorded in its correct time and frequency. That completeness is what lets an analyst reconstruct a full hop set, estimate the hop rate, and decide how to respond, whether that means following the emitter, cataloging it, or countering it.
8IQ record and playback
The decisive advantage of a real-time platform is that it keeps the raw evidence. When the instrument captures IQ data, it stores the complete in-phase and quadrature samples of the signal, not just a processed picture. That recording contains everything the receiver saw in the captured bandwidth, which means analysis is not limited to what the operator chose to display at capture time.
This changes the work of EW analysis. A mission can be recorded in the field and re-run later in the lab, as many times as needed, with different settings each pass. An analyst can replay an engagement, change the resolution, apply different demodulation, or re-examine a moment that looked unremarkable live and turned out to matter. Nothing is lost to a setting that was wrong at the time, because the raw samples are preserved.
Recorded IQ is also how threat libraries are built. Each well-characterized capture, with its PDWs and modulation analysis, becomes a reference entry that future detections can be matched against. Over many missions the library grows into an institutional record of the emitters in a theater, so that a signal seen once and understood can be recognized instantly the next time it appears.
9Fielding the capability
A laboratory analyzer that never leaves the bench cannot do electronic support at the edge. The capabilities above only matter to the EW operator when they fit in a form that survives the field. The ICX-FieldHawk line carries real-time spectrum analysis into forward environments without giving up the performance that makes it useful.
The ICX-FieldHawk-R is the rugged member of the family, built to an IP68 sealing rating for dust and water immersion and carrying onboard AI to assist with detection and classification at the point of collection. It is intended for forward electronic support and electronic attack and for counter-UAS work, where pop-up and agile emitters are the routine targets rather than the exception.
The ICX-FieldHawk-U is the USB-form member, designed for embedding into larger systems and for integration with software-defined radio workflows. Where an integrator needs the real-time engine inside a custom platform, a vehicle, or a fixed site, the USB form delivers the same processing in a package that other software can drive.
For direction finding, the ANT-100G directional antenna pairs with either receiver to turn a detection into a bearing. Once an emitter is found, the directional antenna lets the operator take the angle-of-arrival measurements that begin the geolocation process. Across the family the coverage spans 9 kHz to 40 GHz with up to 100 MHz of real-time analysis bandwidth, and all of it runs on the SpecICX-gen3 firmware, so the persistence displays, mask triggering, pulse analysis, and IQ record described above behave consistently from one form factor to the next.
10Recommended configuration and closing
For a forward electronic support and counter-UAS role, start with the ICX-FieldHawk-R rugged receiver for its sealed enclosure and onboard AI, pair it with the ANT-100G directional antenna for bearing measurements, and standardize on SpecICX-gen3 across the unit so operators see the same density displays, mask triggers, and pulse tools everywhere. Where the requirement is to embed real-time analysis inside a vehicle, a fixed site, or an SDR-based system, choose the ICX-FieldHawk-U USB receiver and drive it from the host platform. In both cases, enable IQ recording from the outset so that every mission feeds the threat library rather than disappearing when the display clears.
The thread through all of it is simple. The threats that matter in electronic warfare are the ones built to be missed. Real-time spectrum analysis is the discipline of not missing them: gap-free capture for a guaranteed probability of intercept, persistence displays to surface the faint and the rare, mask triggering to automate the watch, pulse and PDW analysis to identify what was found, and IQ record to study it and keep it. Put that capability in a rugged, fieldable form and the operator stops reacting to the spectrum and starts reading it.
Talk to an engineer
To discuss a configuration for your mission, contact Berkeley Nucleonics at 800-234-7858 or info@berkeleynucleonics.com.
For a quick question, chat with an engineer at berkeleynucleonics.com.